Jan 6, 2021
Charting 2020: The Top 10 Storylines of the Year
As an investor trying to make sense of the world, 2020 is nearly impossible to briefly recap. Rather than delving into the multitude of data from this extraordinary year, we gathered the 10 charts that most impacted the 2020 markets.
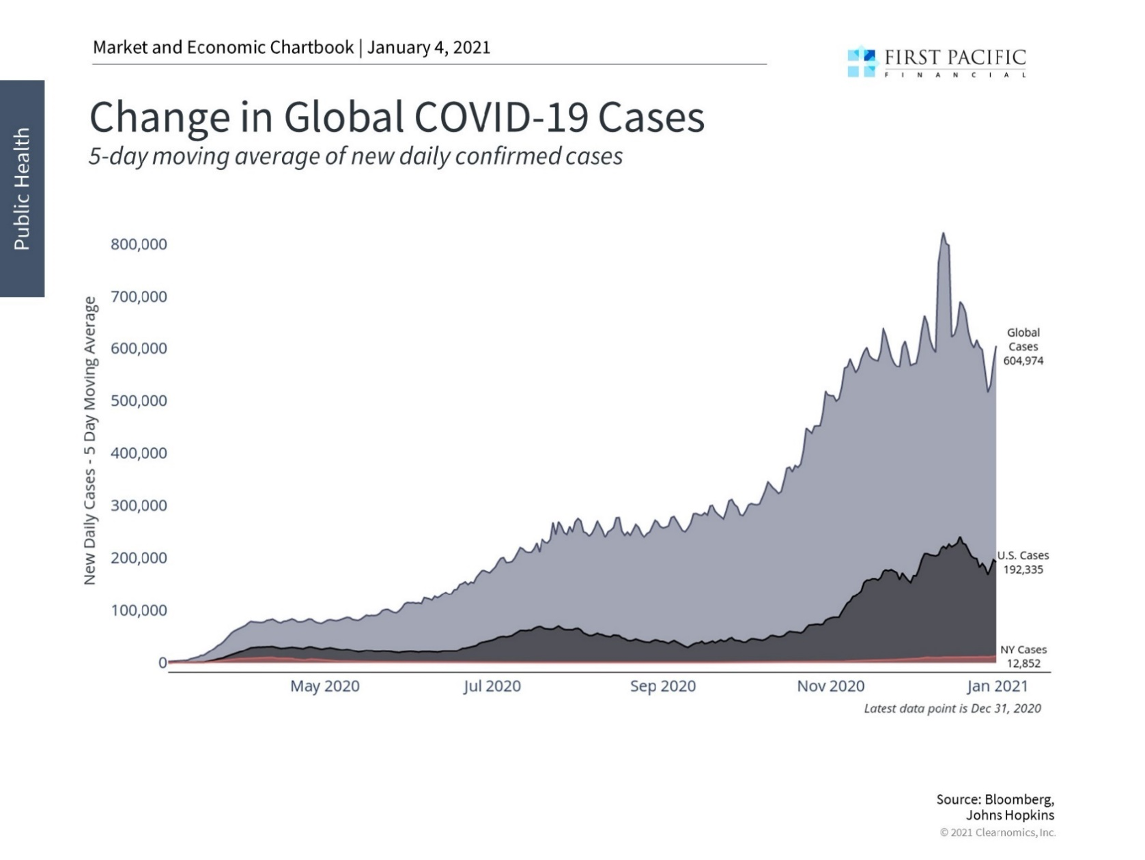
1. Covid-19 cases became the most closely watched statistic for public health officials, but also for the general public as we were all affected by the pandemic in different ways. “Flattening the curve” became a catchphrase as we hoped the daily new cases would be minimized from the stay-at-home orders from government officials.
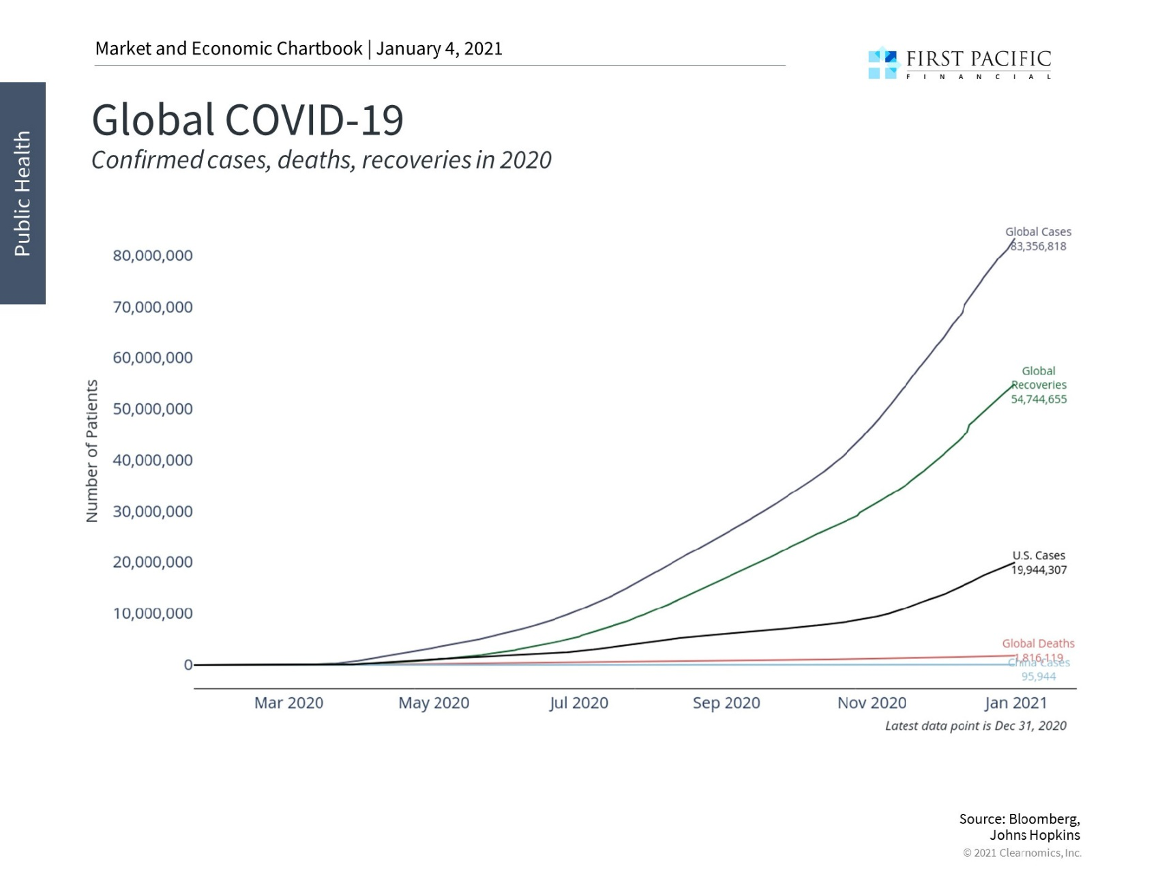
2. The pandemic ravaged through our countries all over the world, taking the lives of over 1,800,000 people in 2020.
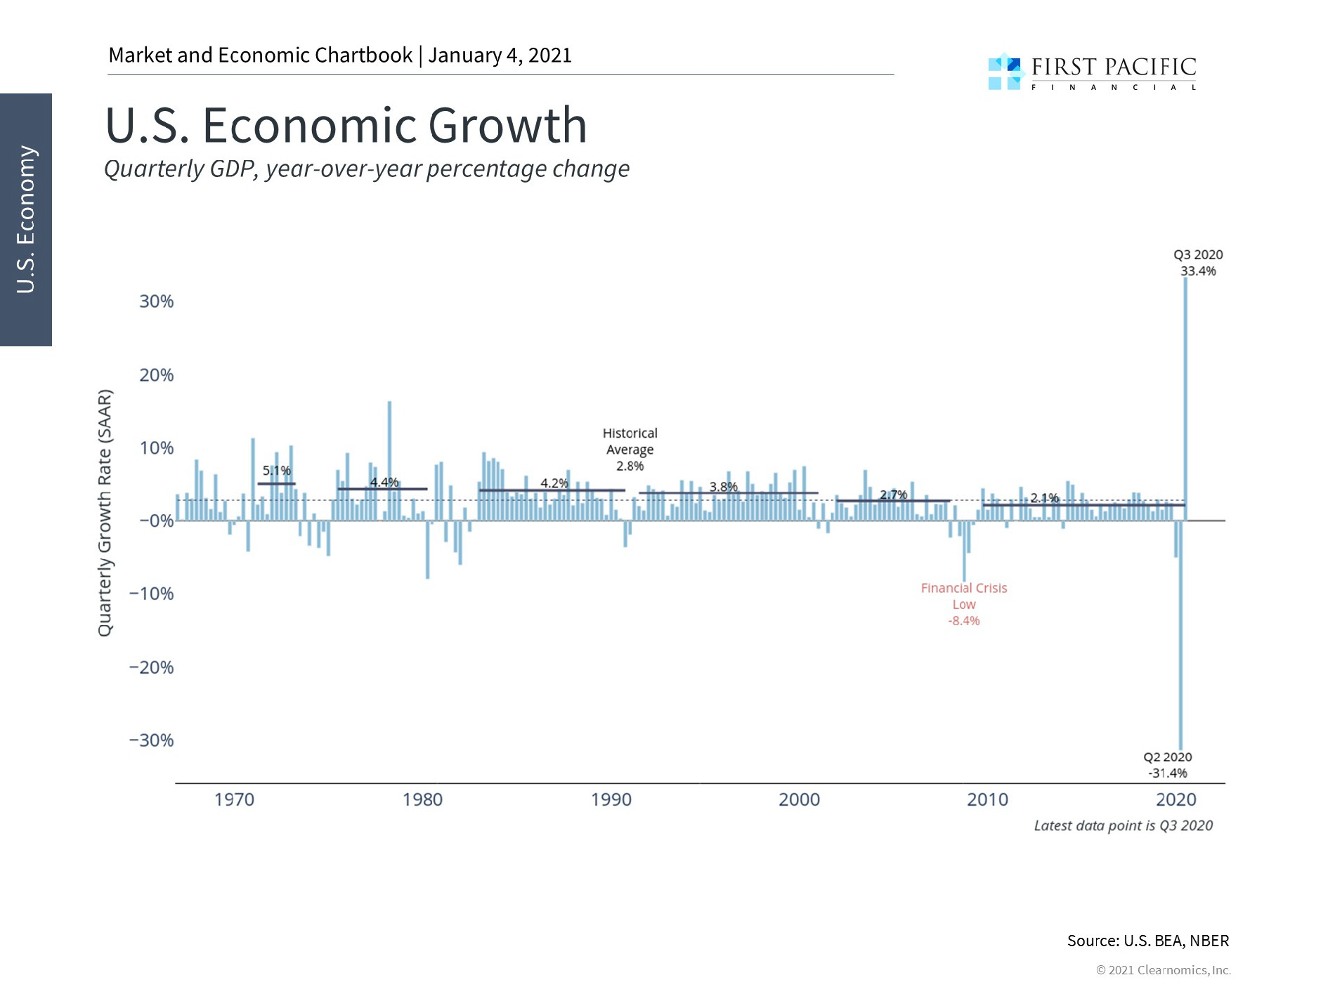
3. United States GDP recorded its worst reading since the Commerce Department began recording. The measures put into place to keep people home and safe caused economic output to crash.
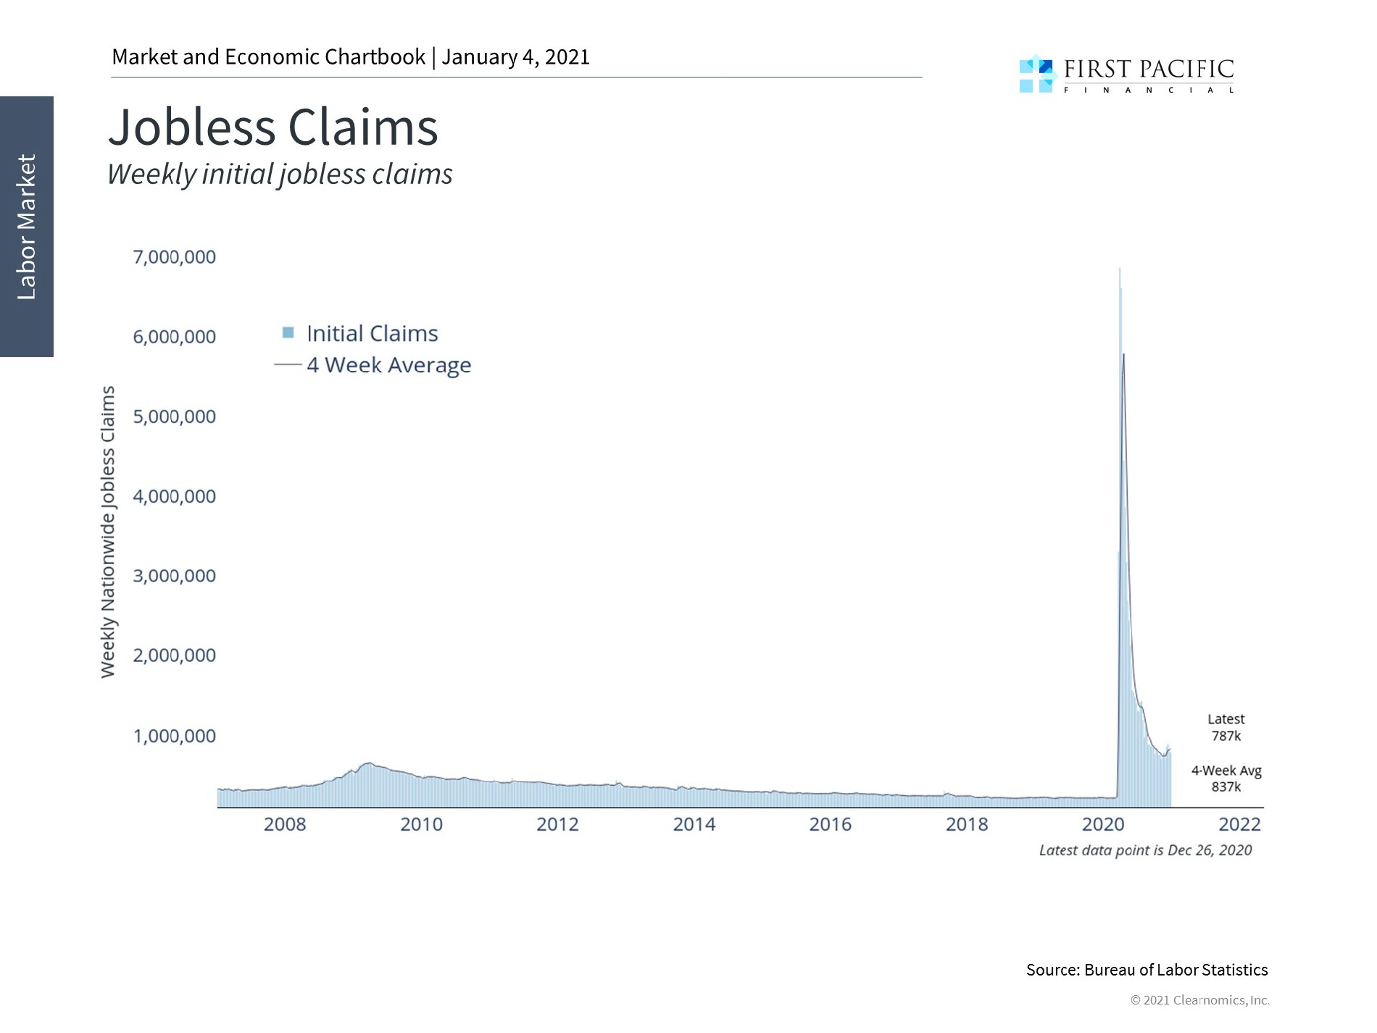
4. Jobless claims in the U.S. skyrocketed as stay-at-home orders were given state by state and many businesses were forced to close.
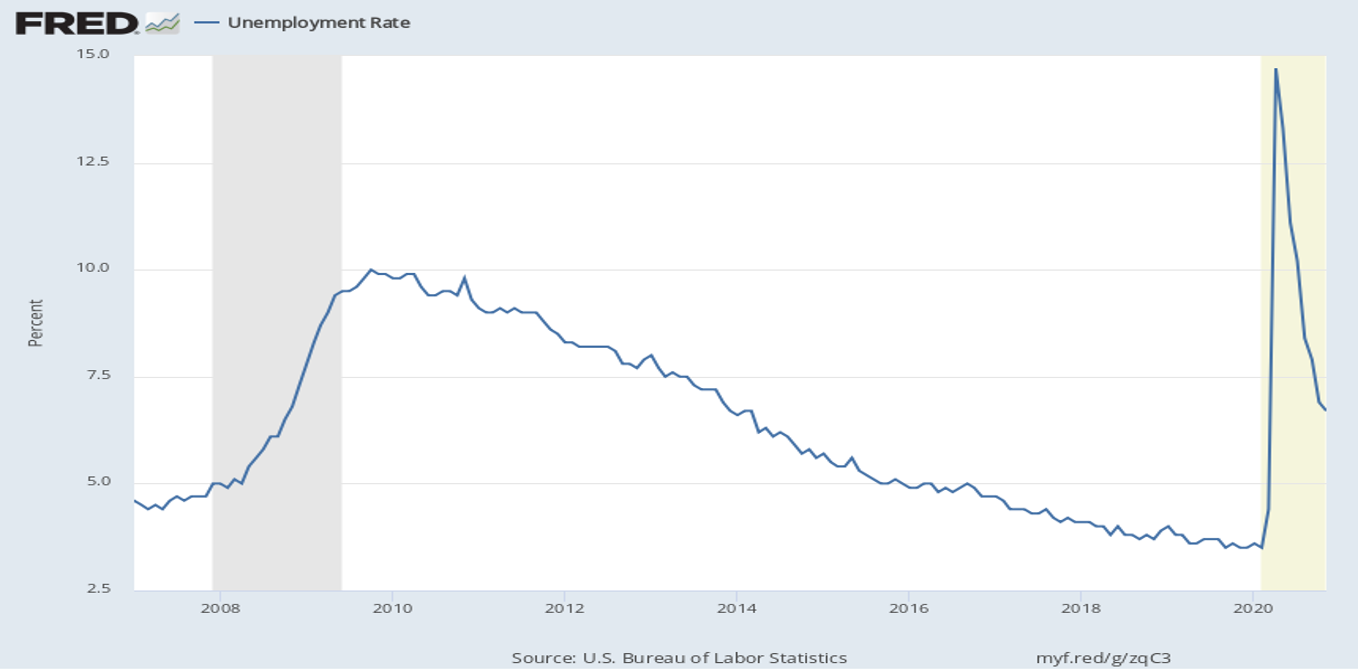
5. As jobless claims skyrocketed, the unemployment rate recorded its worst reading since the Great Depression at nearly 15%.
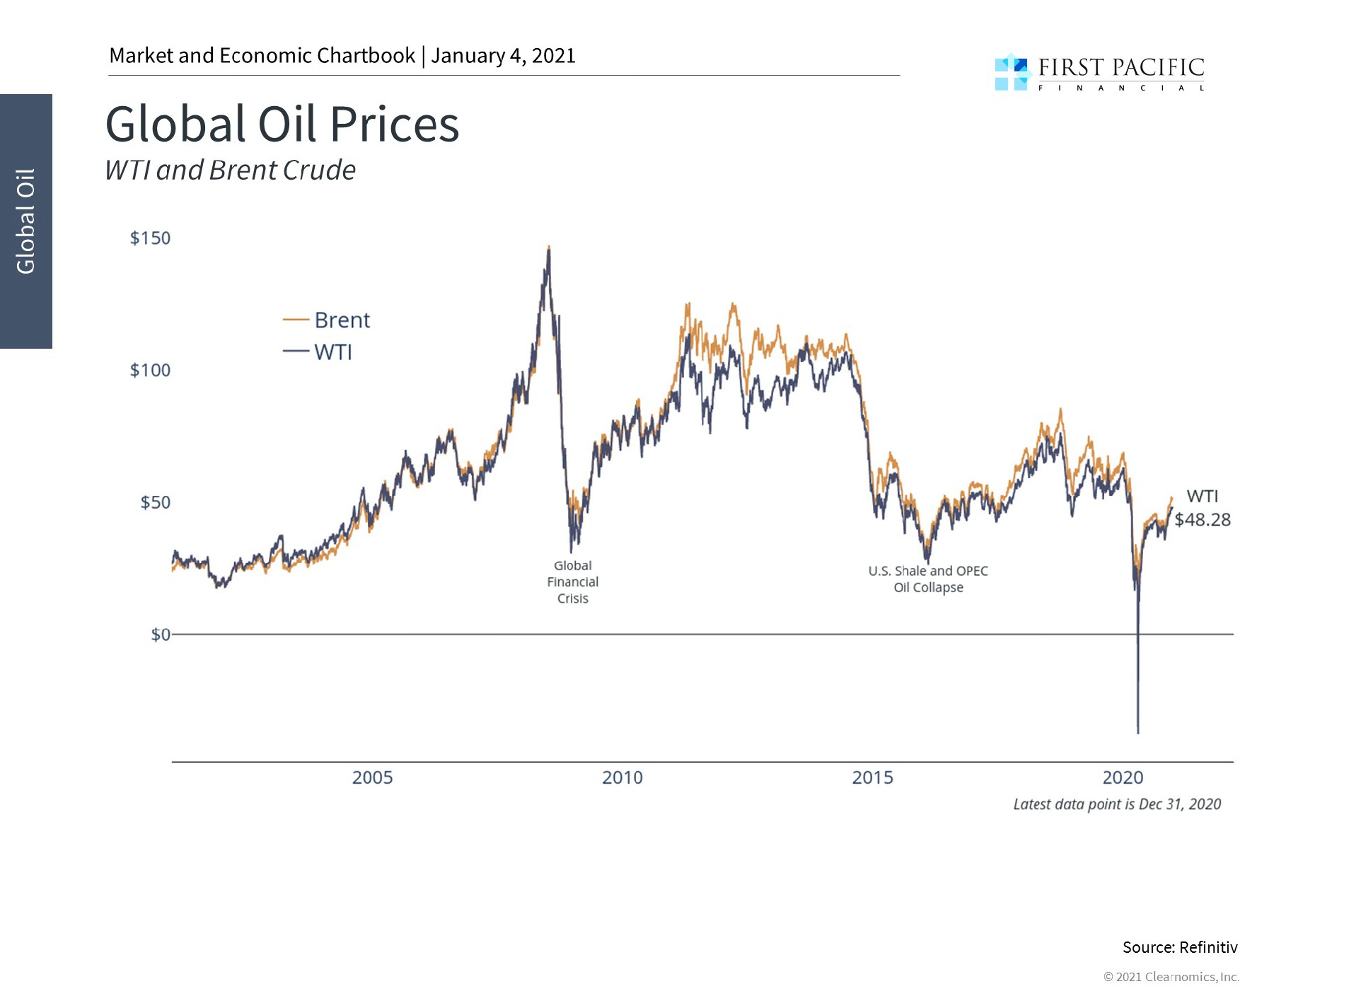
6. The demand shock to energy prices caused an oversupply never seen in history. It perplexed the oil markets as prices went negative for a brief time, meaning suppliers would need to pay the buyer to sell their oil!
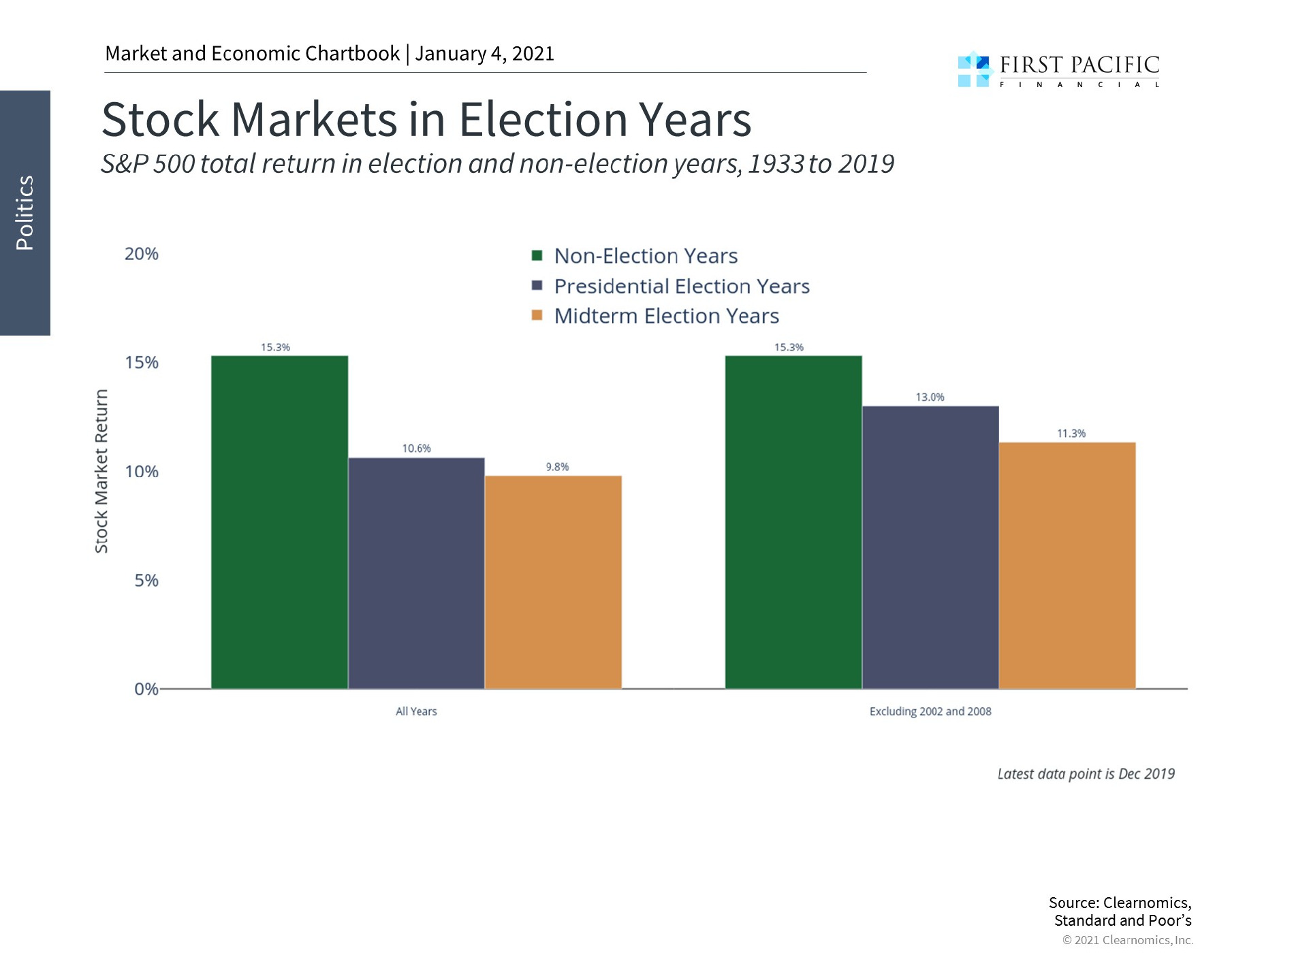
7. The presidential election of 2020 shaped up to be less consequential for the stock market than many had planned for, which was probably a good sign after all we went through. The market (as measured by S&P 500) returns outpaced all historical averages, returning 18.4% for 2020.
8. In a tale of two stock markets, a narrow group of public companies actually benefitted from the pandemic. The stay-at-home orders boosted returns for stocks such as video conferencing, data security, and online orders. Stocks from the major airliners were well into negative return territory for the year.
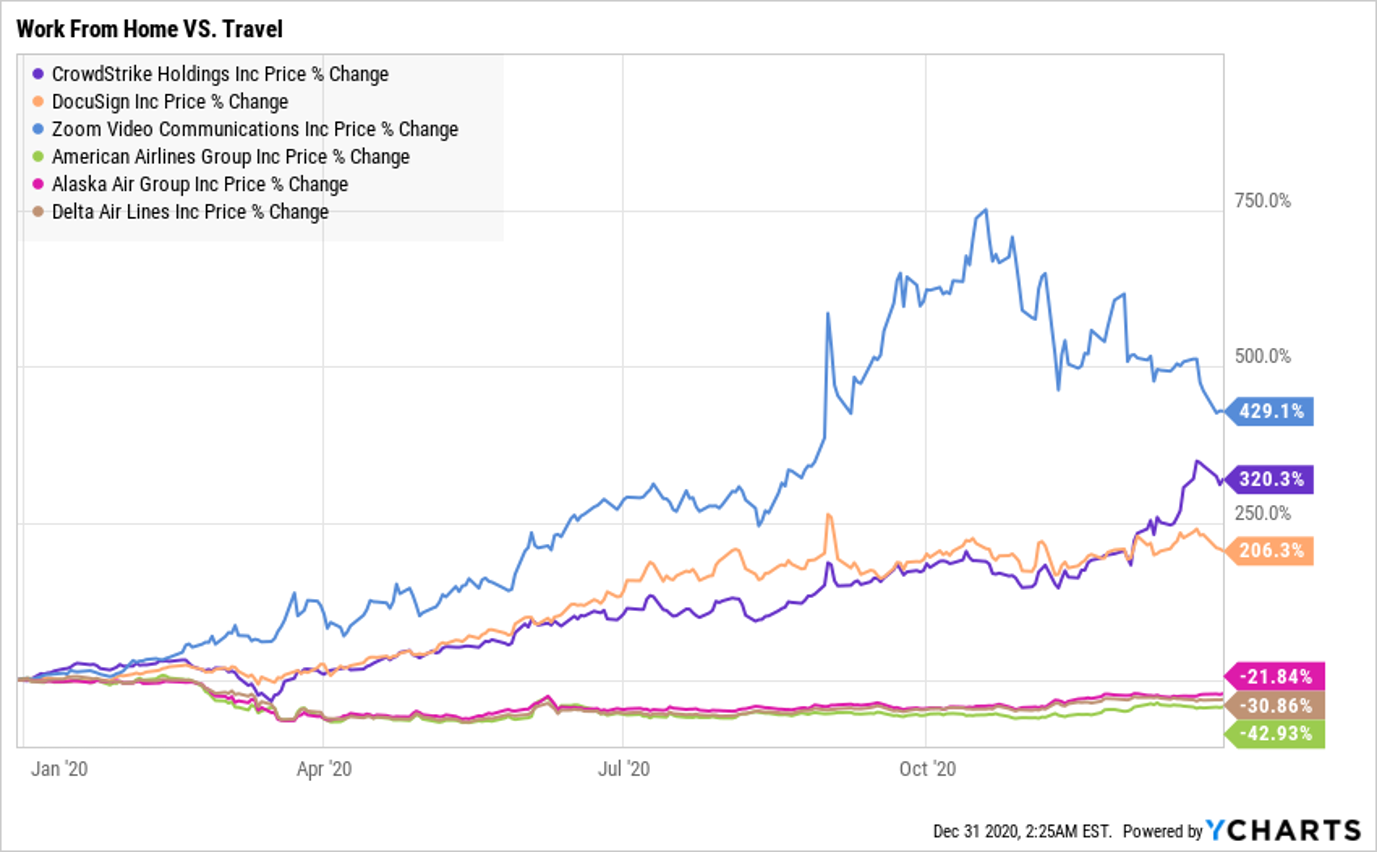
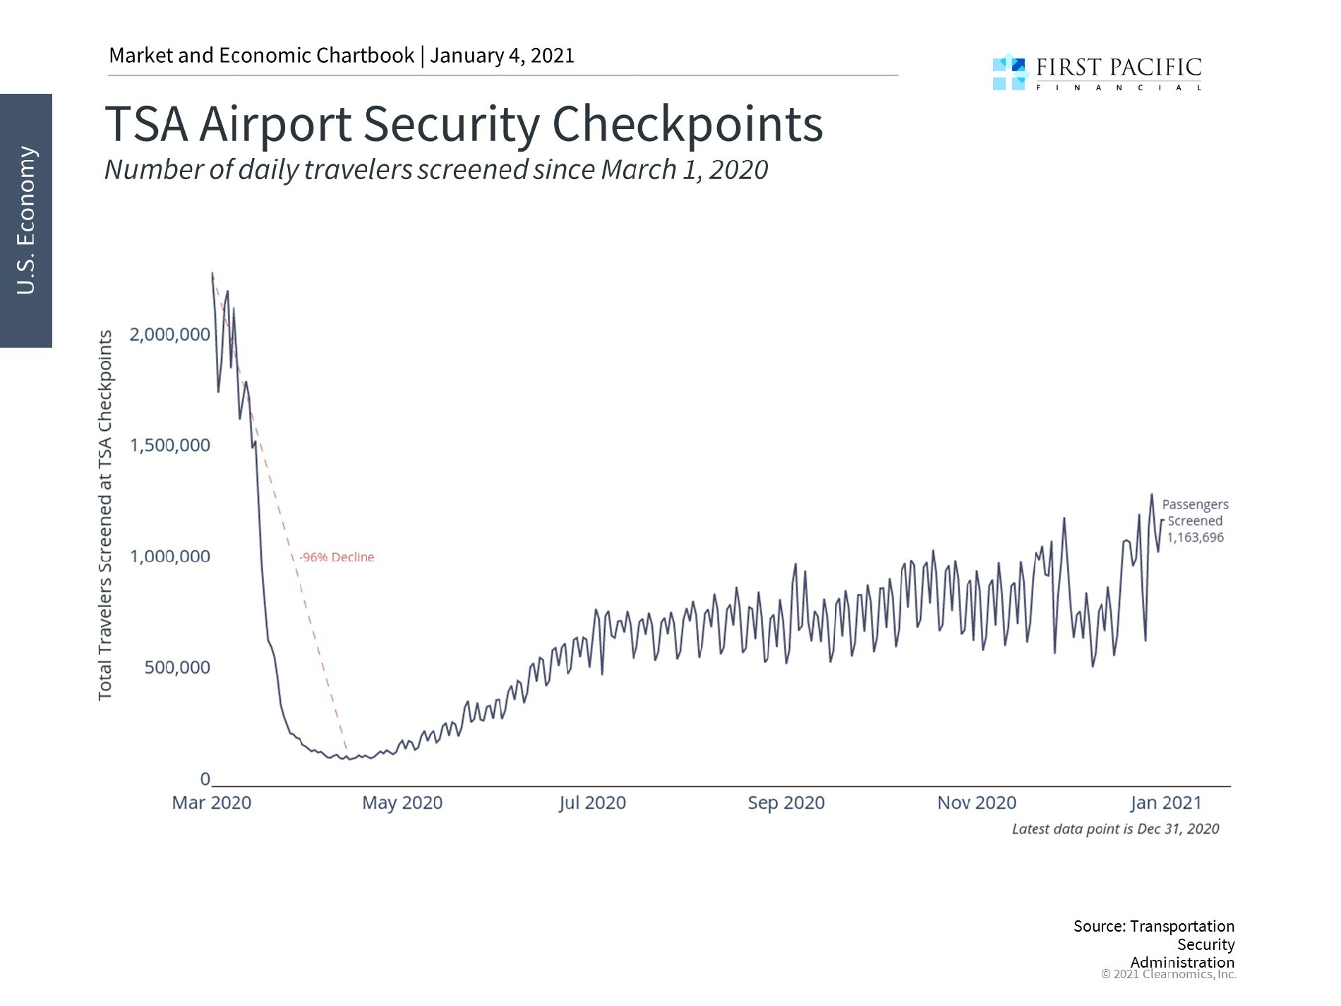
9. After plunging 96%, air travel has begun recovering but has a long way to go. For this recovery to accelerate, we will likely need the vaccine widely distributed.
10. By taking different safety measures than the United States, other countries have been able to limit new cases. The virus is largely under control in Australia and many Asian countries. This phenomenon has also led to faster-improving economic data in those regions.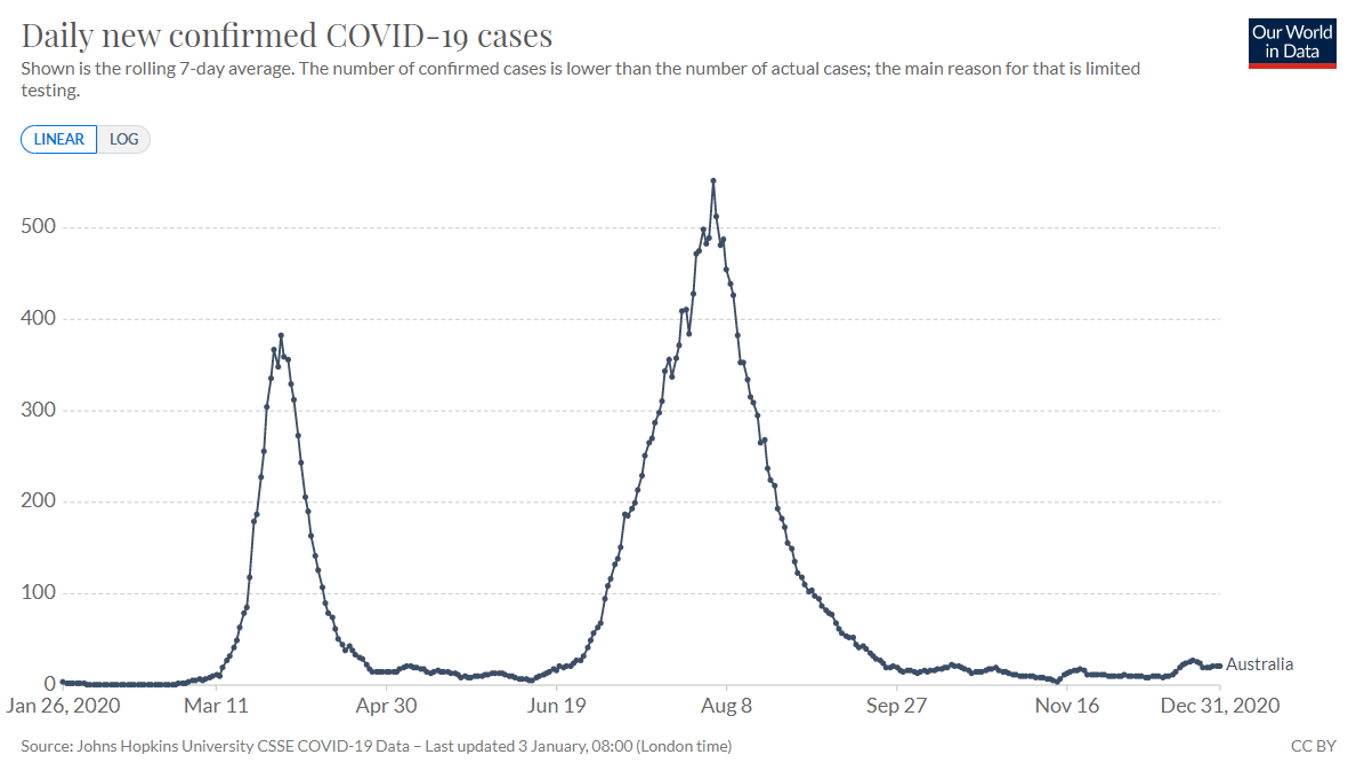
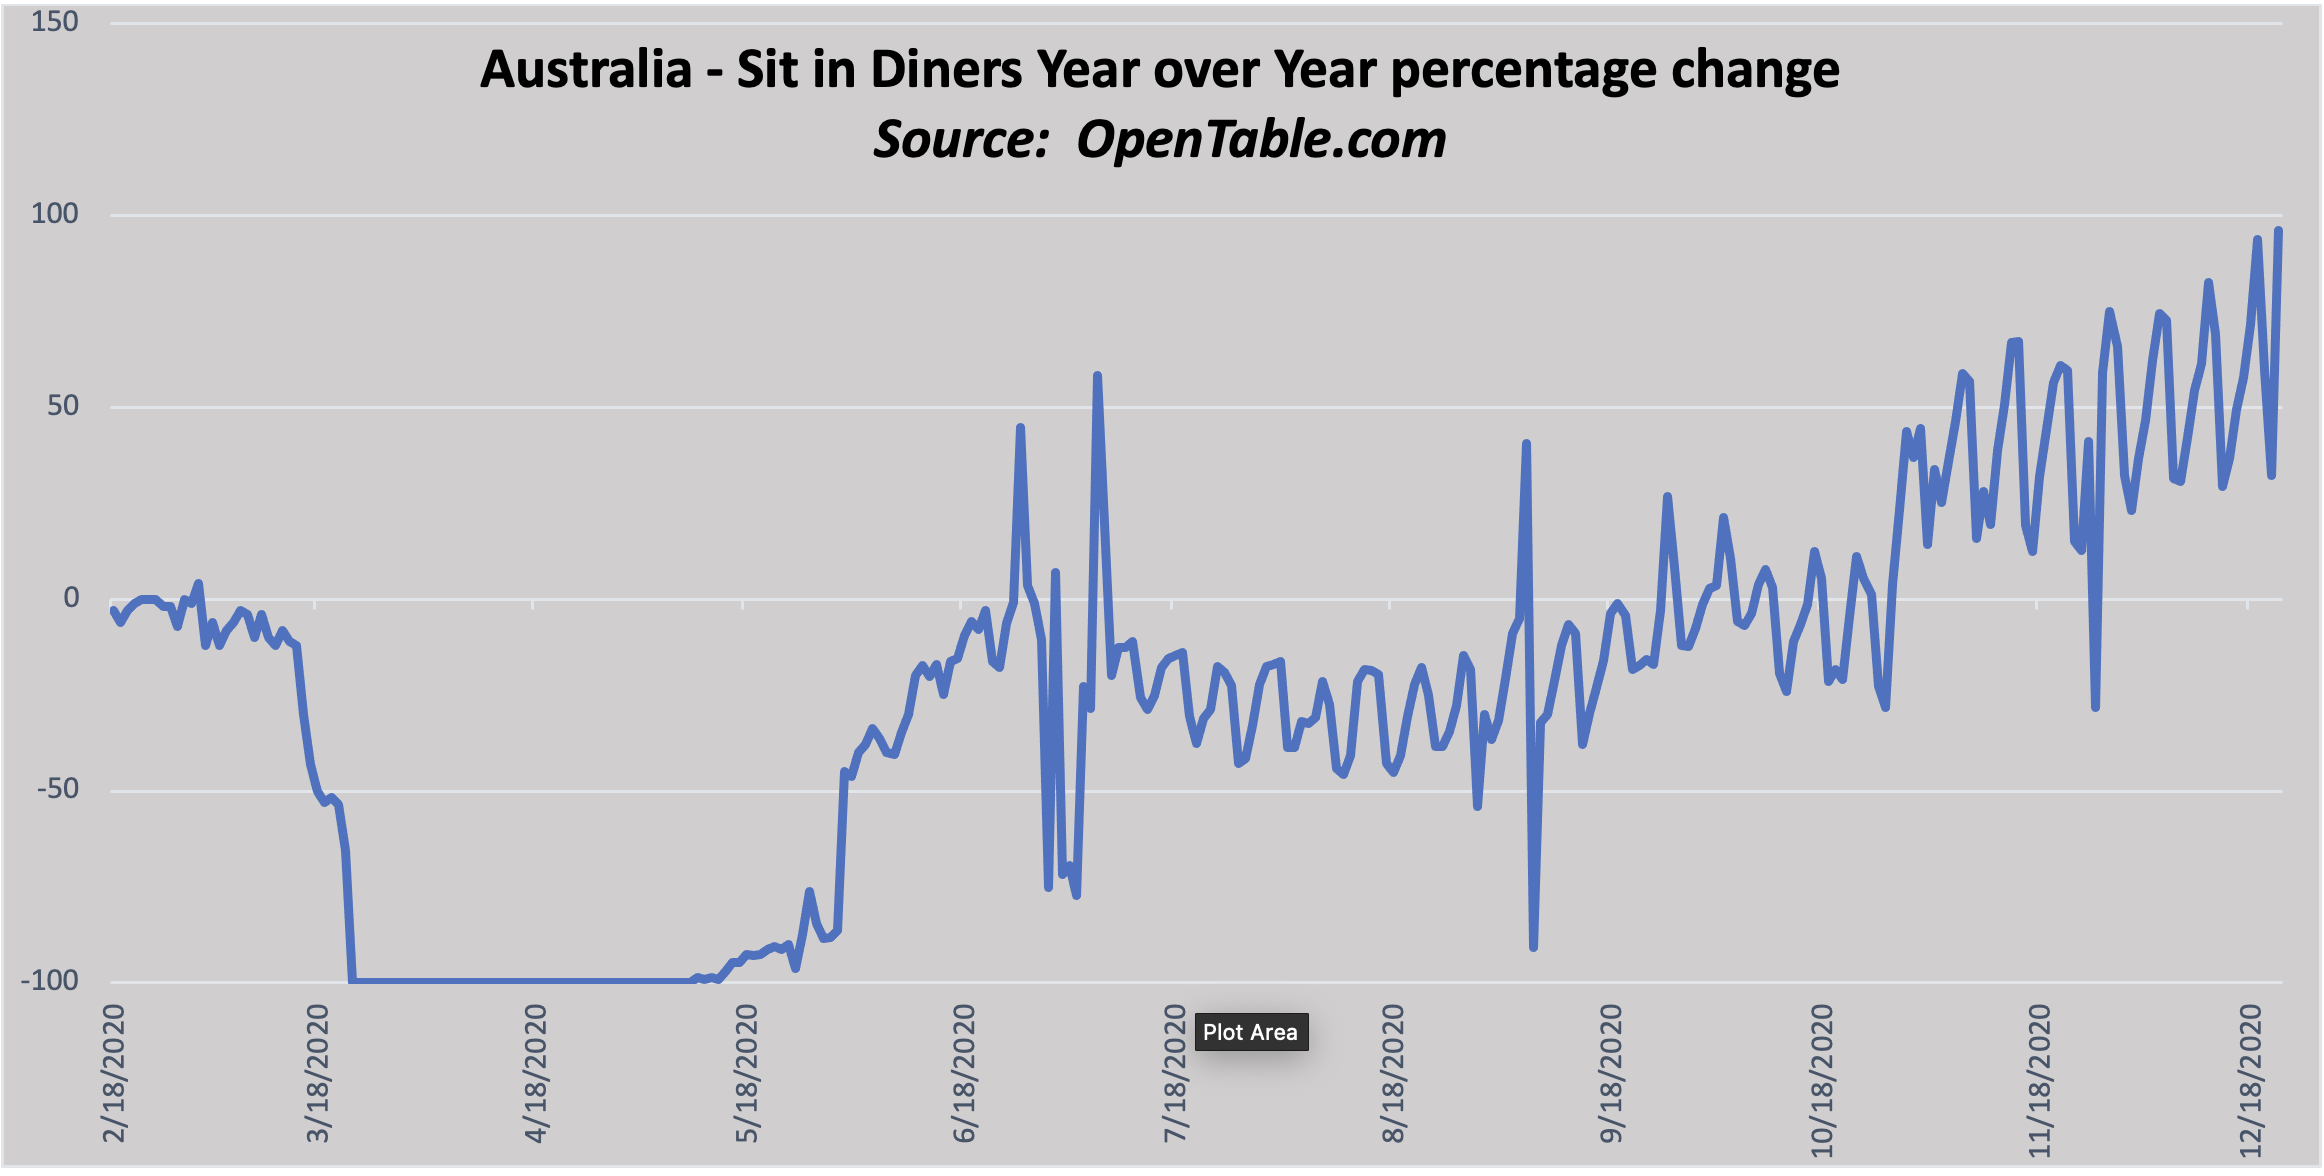
Bonus Chart: Specifically in Australia, restaurants are filling up again. Dining out is at a level greater than when the virus reached the country. In fact, the Australian data may signal what we should expect once our economy can fully re-open. The pent up demand for dining out, travel, and other consumer spending may be in our future.
Disclosures:
Past performance is not indicative of future returns. Information contained in these reports is not investment advice and is for educational purposes only. It is not meant to be a recommendation to buy or to sell securities nor an offer to buy or sell securities.
